In the context where each country has committed to decrease its own emissions, air quality monitoring of atmospheric pollutant concentrations is of paramount importance. Geostatistics provides relevant solutions for mapping pollutants (nitrogen dioxide, particles, ozone, etc.) and air quality indices related to regulatory thresholds.
Geovariances has a solid experience in air quality monitoring acquired through numerous projects, including those conducted for the French associations for air quality monitoring (AASQA) and the French Environment and Energy Management Agency (ADEME).
INCREASE DATA VALUE WITH A SECURE QUALITY PROCESS
Before starting any pollution assessment, it is essential to control the quality of your data. This preliminary investigation and cleaning work allows ensuring strong basis and supplying reliability to your mapping process. Thorough exploratory data analysis allows identifying and handling data anomalies and highlighting homogeneous areas. All available information (diffusive sampling campaigns, automatic measurement stations, mobile laboratory) can be combined in a consistent way. This key step adds value to your data, independently to their quality or number, and helps in the production of a reliable model.
GET A RELIABLE POLLUTION MAPPING
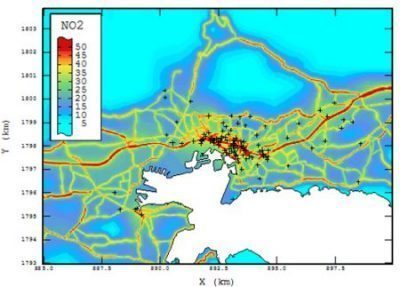
The geostatistical mapping algorithm, called kriging, is based on the specific behavior of the phenomenon via a spatial correlation function calculated from the sample measurements. Because this correlation function determines the shape of the final map, the geostatistical algorithm adapts itself directly to the spatial characteristics of the pollutant concentrations, thus eliminating the need for a subjective evaluation. Through the modeling of the spatial behavior, kriging enables to produce accurate maps of pollutant at a local, regional or national scale. Kriging presents also the advantage of providing uncertainty associated to the estimation. The precision of the map is quantified with the kriging variance.
Geostatistical processes allow taking advantage of the multiplicity of information sources integrating spatial correlation of the pollutant with auxiliary information (pollution and meteorological forecast models, traffic density, industrial emissions, topography, soil occupation, meteorology). Auxiliary information can easily be taken into account to refine the final map and to give information about under-sampled areas.
ASSESS POPULATION EXPOSURE
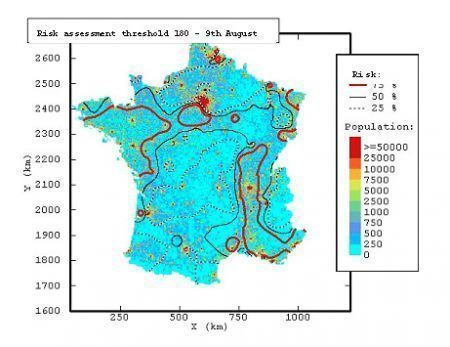
Geostatistical simulations allow computing equally probable images of the reality which are used to assess the variability of the phenomenon and to perform accurate uncertainty quantification. This method provides a reliable solution to answer to public health questions by providing indices of population exposure to air pollution.
Key results include:
- the probability of exceeding a pollutant threshold over a given period (day, week, year)
- the probability distribution of the number of inhabitants exposed to a pollution that exceeds regulatory limits.
OPTIMIZE YOUR MONITORING NETWORK
The probabilistic framework of geostatistics enables the calculation of different uncertainty indices such as the estimation variance or confidence intervals related to the pollution estimate. Therefore, it is possible to tune additional sample locations to reduce specific uncertainty criteria. In the case of the estimation variance, as this one only depends on the spatial structure and the data configuration, additional samples will be located in under-sampled areas. Points located to reduce confidence intervals around kriging estimates will be expected to be in areas with high variability.
UPDATE YOUR COMMUNICATION MEDIA IN AN AUTOMATIC WAY
Because your data can be collected automatically at regular time intervals, it is possible to generate maps in real-time using Isatis scripting procedures. A set of calculations is stored, as well as the input data and parameters. The entire workflow is then replayed. This powerful tool can be used to produce updated maps for communication via the internet.