Geostatistics for the characterization of nuclear facilities, sites and waste
Geostatistics is a relevant tool for characterizing the radioactivity at each phase of a decommissioning project (during operation, after shut-down, or during dismantling), a site remediation project (during site investigation and after remediation work to check the site compliance with cleanup regulations) or in post-accidental context.
Whatever the phenomenon (contamination, activation, NORM, …) and the impacted materials (soil, concrete, groundwater, graphite, process equipment, …), geostatistics offers a range of tools for:
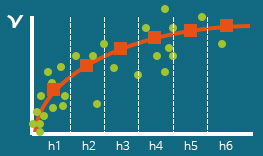
– sampling campaign optimization to meet the quality objectives of each phase of the characterization process,
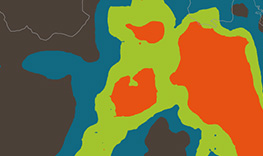
– identification of the contamination extension,
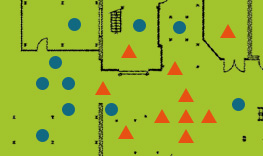
– sound radiological waste classification enabling a quantified risk analysis that informs decision-making.
In the nuclear industry, geostatistics also advantageously applies to other fields: hydrogeology, carbon content, waste packages, etc.
Make informed-decisions
With our solutions, you can...

KARTOTRAK
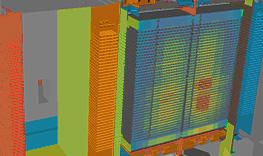
THE INTEGRATED SOFTWARE SOLUTION FOR CONTAMINATED SITE AND SOIL CHARACTERIZATION Discover KARTOTRAKCEA LASE has developed the Digital Autoradiography technique to obtain images of radionuclides that can be found in nuclear wastes and are difficult to measure. Kartotrak is used to process the large datasets that derive from it and produce accurate maps of radionuclides.

Geovariances has developped a dedicated geostatistics-based library which is part of ISYmap's GLOBall, a revolutionary system allowing remoted and fast dose rate measurement and mapping, easy and quick to set up by operators staying far from hazard area in safe conditions.
"Using Kartotrak, less than one hour separates the receipt of field data acquired through an aircraft-embedded system and the delivery of an interpolated map."
Hear from our customers
WHAT IS HAPPENING IN YOUR INDUSTRY?


Resources
-
Isatis.neo Standard Edition (version française)
-
Isatis.neo Standard Edition
-
Kartotrak – Renforcez la précision de vos diagnostics de sites contaminés et optimisez vos plans de réhabilitation et de démantèlement avec la géostatistique | Optimisez vos campagnes d’échantillonnage et réduisez les coûts. Affinez la caractérisation de contaminations chimiques ou radioactives. Trouvez le juste équilibre entre performance de la réhabilitation et volume de déchets grâce à des analyses de risque robustes.
-
Kartotrak – Improve contaminated site diagnosis and optimize remediation and decommissioning plans with geostatistics | Optimize sampling campaigns and save on costs. Improve contamination characterization, whether chemical or radioactive. Balance remediation efficiency and waste volumes and make the best decision.
-
Isatis.py, geostatistical Python library by Geovariances | Geovariances Python package for geostatistics


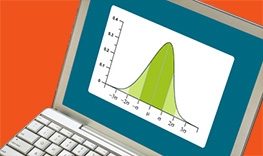
Data Quality Control
Before starting an evaluation of the contamination leading to decision-making tools for site clean-up, it is essential to ensure data quality. Thus, based on solid and reliable foundations, uncertainties occurring during the different steps of the decision process will be better controlled and the final quality of the project improved.
The objective of this white paper is to assess at best the validity of the data through visual, statistical and geostatistical basic tools before going further into their analysis.

Dose Rate Mapping
The objective of any serious mapping is to obtain a realistic and reliable image of the studied phenomenon. Concerning dose rate, maps are often derived from punctual measurements interpolated using deterministic methods. Sometimes, the choice of the inverse distance squared weighted interpolation is wrongly justified by the fact that the dose rate issued from a punctual source is theoretically inversely proportional to the squared distance between the source and the measurement point.
Through this white paper, find out why this inverse distance squared weighted interpolation is not the appropriate method for dose rate mapping and why the geostatistical approach by kriging is the solution for a quality and reliable mapping.
-
Enhancing environmental radionuclides tracking: High-resolution isotopic analysis using NanoSIMS | Presented at Goldschmidt Pragues 2025 - Louise Darricau (IRSN)
-
Geostatistical mapping of a contaminated riverbank in Norway – ICRER 2022 | ICRER 2022 - T. K. Eriksen (Institute for Energy Technology, NUK Kjeller, Norway) and Y. Desnoyers (Geovariances)
-
Geostatistical mapping of two nuclear sites in Norway – ICRER 2022 | ICRER 2022 - M. Bourgeaux-Goget (IFE) and Y. Desnoyers (Geovariances)
-
Characterization of Radioactively Contaminated Land – IAEA Nuclear Back End Webinar Series 3.5
-
Methodology for the Estimation of Contaminated soil by a Geostatistics-based method | WM2023 - E. Moreno (CEA Marcoule), Y. Desnoyers (Geovariances), I. Bisel (CEA Marcoule) and P. Marty (CEA Marcoule)
-
Assessment of ambient dose equivalent rate distribution patterns in a forested-rugged terrain using field-measured and modeled dose equivalent rates | M. Yasumiishi, P. Masoudi, T. Nishimura, K. Ochi, X. Ye, J. Aldstadt, M. Komissarov - Radiation Measurements, Volume 168, 2023, 106978, ISSN 1350-4487, https://doi.org/10.1016/j.radmeas.2023.106978.
-
Fuzzy membership function for weighting pairs in variographical analysis | P. Masoudi, Spatial Statistics, Volume 52, December 2022, 100717, ISSN 2211-6753, https://doi.org/10.1016/j.spasta.2022.100717
-
Methodology for Contamination Estimation by a Geostatistic-based Method | WM2023 - E. Moreno (CEA Marcoule), Y. Desnoyers (Geovariances), I. Bisel (CEA Marcoule) and P. Marty (CEA Marcoule)
-
Smart use of the variogram to explore spatial data, break down variance contributions and model radiological contaminations | by Yvon Desnoyers - Presented at the workshop "Statistical methods for safety and decommissioning" - Nov. 22-24, 2022 - Research Group MASCOT-NUM
-
Metallographic characterization by variographic analysis and geostatistical simulation of local segregation microstructures in a heavy thickness forged part in SA508 Gr3 Cl2 type steel | FONTEVRAUD 10, 2022 - Y. Desnoyers (Geovariances), P. Masoudi (Geovariances), P. Joly (Framatome), E. Deneuvillers (Framatome)