Volume and surface calculations are based on probabilistic maps, produced by simulation. They help decision-makers in choosing a consistent operational threshold with balances between the reality of waste volume and the available budget. Therefore, the output could be used directly in feasibility studies.
Map the risk to exceed a threshold
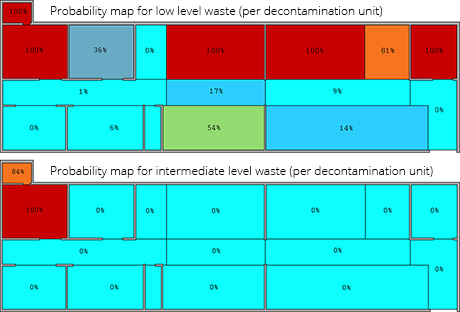
Geostatistics allows plotting contaminated surface or volume as a function of thresholds, which is a global view of contamination. A cost-benefit analysis is conducted on the probability of exceeding a specified threshold. It allows categorizing surfaces or volumes to optimize radioactive waste routes and management.
Besides, an interesting risk presentation is the false negative: an area is declared to be below the threshold using estimate results but exceeds the threshold for real (but unknown) value. Depending on the threshold, acceptable risks may vary, and corresponding surfaces change. The estimation support must be taken into account to discriminate punctual issues, such as hot spot identification, and waste production issues on larger areas/blocks.
Download our tech paper about Geostatistics cost-benefit analyses for classification of waste during initial radiological characterization to learn more →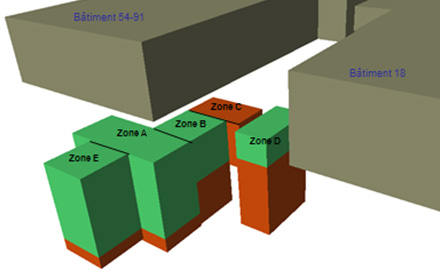
Prepare your excavation plan
Geostatistics provides tools for planning excavation and/or decontamination procedure, which is contouring local contamination according to waste categorization.
As for remediation costs, they naturally increase with the required confidence level: the lower the risk, the larger the corresponding surface. The risk to be considered mainly depends on the activity threshold (between different radiological waste categories). The support effect has a strong impact on high probability (low risk) results with the averaging effect when uncontaminated areas (in comparison with the threshold) are mixed with contaminated ones within a large remediation unit.
Accessibility volumes (green on the picture) are also addressed correctly (not to be considered nor mixed with contaminated materials).
Watch a short video about how Kartotrak helped identify the origin of a contamination.