We gain time processing data with Kartotrak
The facts
IRSN – the Institute for Radiological Protection and Nuclear Safety – is the French national public expert in nuclear and radiological hazards. The organization is in particular in charge of monitoring the radiological levels over the French territory, which is basically achieved through a network of probes measuring in a continuous way the gamma radiation in the ambient air. The network is also able to send alert to an operator if necessary (Teleray network).
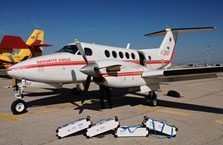
In 2012, IRSN complemented its network with mobile equipment and today, carbone and airborne measurements are regularly performed to collect data in a much denser manner over the whole territory, during peacetime but also in case of nuclear emergency.
The challenge
Clear and concise report of large amount of data
The transition in 2012 from static measurements to mobile measurements was the trigger for a new way of communicating results. IRSN manages a large amount of data and have to report them to the public. Then, the need arose for a tool helping them to communicate results in a clear and concise way. Providing maps from data was a natural choice, but representativeness of such reporting has to be a priority.
“For the purpose, we have implemented a standard GIS (Geographic Information System) which allows us to quickly process data and get maps”, Head of IRSN Atmospheric Monitoring and Alert Laboratory (LS2A) Christophe Debayle says. “However, we were skeptical about interpolation maps quality because we had no idea about the parameters automatically set by the software to compute the maps, the software acting as a black box”, Christophe Debayle adds. “So, after few months studying about geostatistics and existing products on the market, we looked for a software solution which would allow us to communicate results quickly whilst enabling map analysis and quality control. But also, we needed an easy-to-use tool, quick to implement in emergency contexts, what I call a “reflex tool”.”
The solution
After being trained in geostatistics by Geovariances, Christophe Debayle was definitively convinced that his choice for Kartotrak software solution was well founded.
He told us why:
- Using Kartotrak, you keep your critical mind on what you are achieving. Kartotrak gives control on the key parameters for the calculation of a map by kriging. It is intuitive to use. The software offers a geostatistical workflow which requires only a few hours of training before feeling comfortable with it.
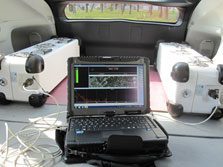
- Kartotrak enables quick loading of data files and is able to process a huge quantity of data at a time. It also allows automatic streaming data acquisition, and so, it is perfectly adapted to mobile data acquisition systems.
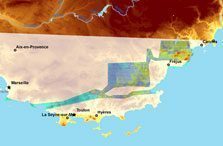
- Kartotrak generates very precise maps, easy to understand, better than a speech. The software allows setting the interpolation grid according to the input data, especially the variance indicator, and adjusting the interpolation area to each project, so avoiding extrapolation and false results where data is missing.
- Kartotrak is a professional software package. When you purchase a license, you get all the associated services, such as technical support and assistance. You do not feel lonely using the software.
The results
Time saving
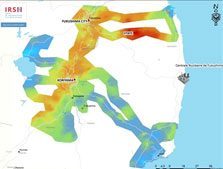
IRSN uses Kartotrak weekly to produce maps. Kartotrak implementation has allowed the organization to gain time processing data. Today, less than one hour separates the receipt of field data acquired through an aircraft-embedded system and the delivery of an interpolated map (including data pre-processing i.e. elevation correction).
Adequate software solution in emergency situations
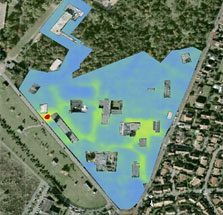
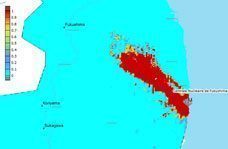
After the disaster of Fukushima in Japan, IRSN was called on to monitor the affected area. Experts on site first requested a paper version of results and then asked for a map reporting measurement values. IRSN offered to provide them with interpolated maps, which they finally agreed.
“Our team was close to the Fukushima Daiichi site.” Christophe Debayle says. “Measurements were being made from a carbone system and automatically collected by a server. We were there to produce maps as quickly as possible reading data from the server, importing it into Kartotrak and restituting everything on a web server.”
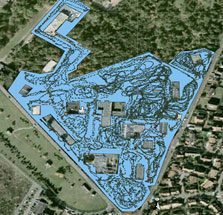
Maps shown were a success because they were really easy to understand. Kartotrak also revealed to be efficient and a very good software solution in emergency situations and, especially, in helping the decision makers with simple maps, like probability maps.
The perspectives
“Kartotrak, in its standard version, supports few specific data formats. That is why I have requested Geovariances that the software is able to read the ANSI N42 data format, a format which tends to become standard data exchange format among spectrometers manufacturers.”
Geovariances just finished the development. It consists in a specific plugin in Kartotrak which reads data from a distant server and stores them in a Kartotrak project in real time as data is being collected by the server.
“Today IRSN is using Kartotrak to produce interpolated maps. However, unlike scientists who need a quantified positive answer “Here, we’ve got this dose”, the public requires negative answers to their questions, like “No, you are not in danger.” “Christophe Debayle says. “One good opportunity to communicate with decision makers or public could be to provide people with two-colour maps, one colour for “Here, you are in danger“, the other one for “Here, you are safe“. This could easily be achieved using the geostatistical simulations and their post-processing.”
And more…
Short movie made by Geovariances showing the combination of an interpolated map (Fukushima data) with a site aerial photography in Kartotrak: