HAROPA PORT: managing large volumes of heterogeneous excavated soil with geostatistics
How can more than 500,000 m³ of excavated soil be managed in a context of heterogeneous soil quality while keeping costs under control? HAROPA PORT relies on a probabilistic geostatistical approach to estimate volumes, anticipate disposal routes, and secure the project budget.
A STRATEGIC PRIORITY
Securing excavation costs through geostatistical risk management
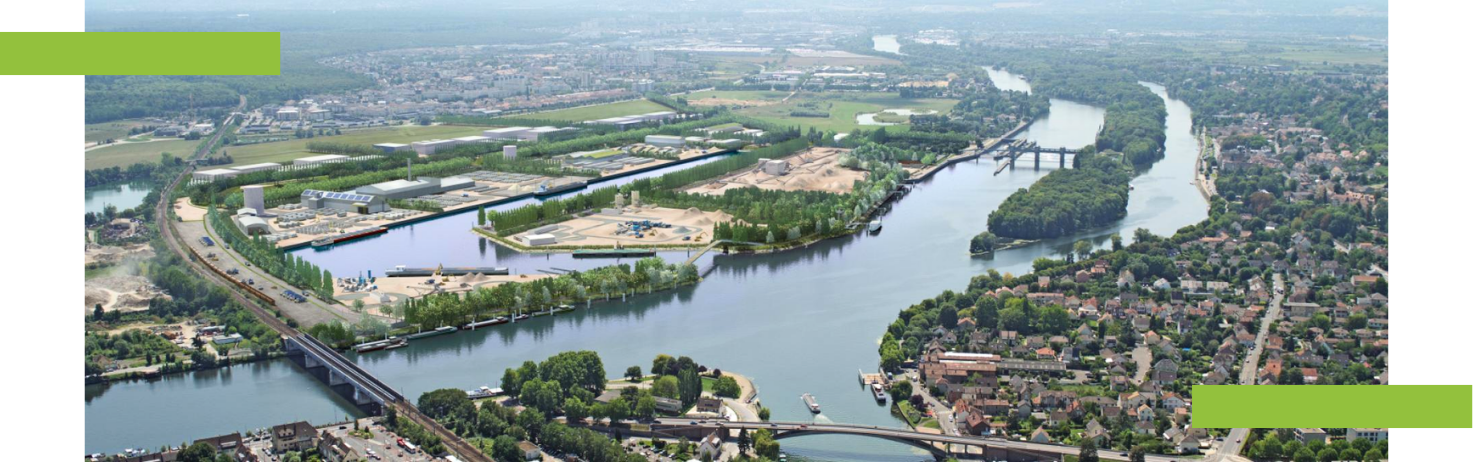
Located at the confluence of the Seine and Oise rivers, the Port Seine-Métropole Ouest (PSMO) project is a multimodal port platform covering approximately 100 hectares that supports the metropolitan area.
The construction of the harbor basin requires the excavation of more than 500,000 m³ of soil.
Given the volumes involved, accurately estimating quantities based on soil characteristics was a major financial issue.
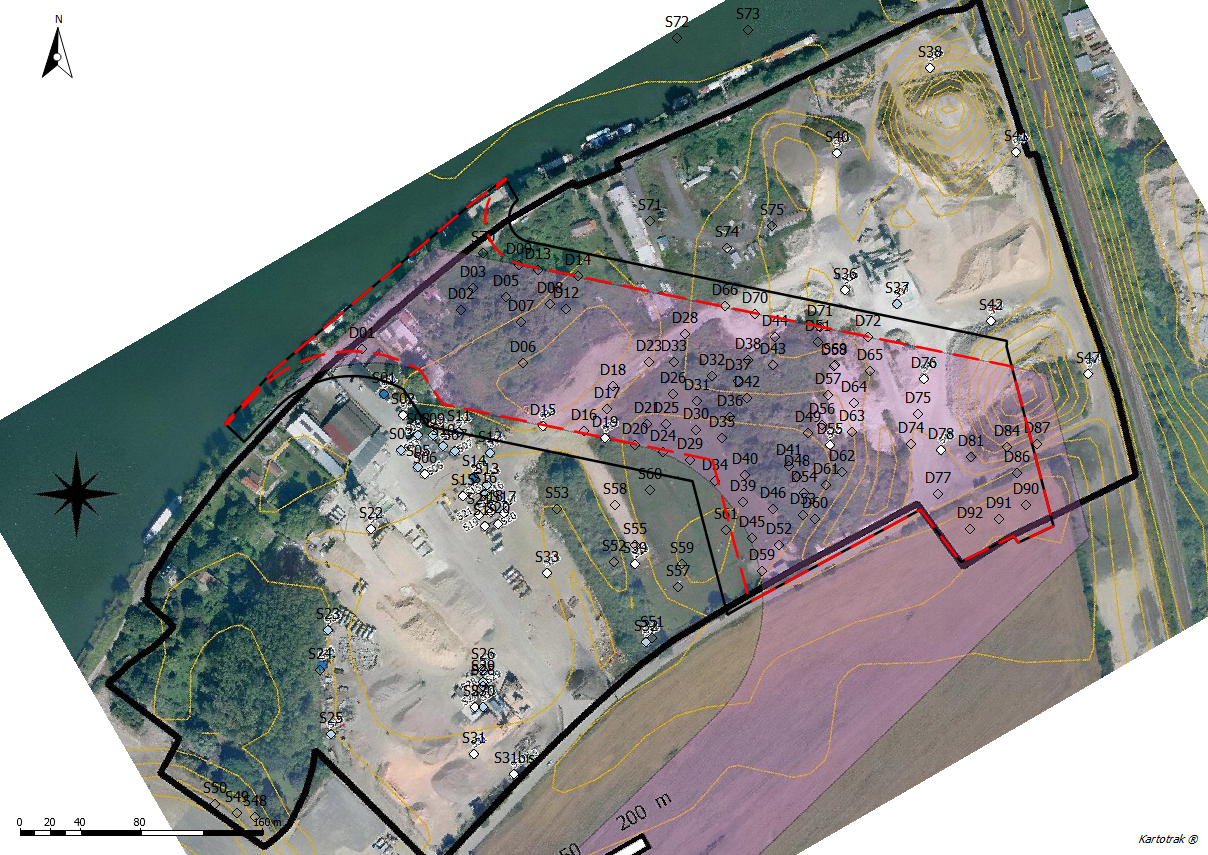
Site overview: aerial view, basin outline and sampling locations.
THE CHALLENGE
A complex problem
The management of excavated soils had to account for:
– 5 potential disposal routes (biocenter, ISDND – non-hazardous waste storage facilities, quarry backfilling, ISDI+ and ISDI – inert waste storage facilities)
– 9 to 10 contaminant concentrations to analyze
– Multiple thresholds, sometimes not hierarchically ordered
– A specific criterion based on the soluble fraction/sulfates ratio (FS/SO₄)
Some disposal routes (ISDI+ and quarry) are not strictly ordered, making soil classification more complex.
In this context, a conventional deterministic approach was not sufficient to properly control uncertainty on volumes and associated costs.
THE SOLUTION
Integrating uncertainty to support decision-making
Geovariances implemented a comprehensive geostatistical methodology combining:
– Statistical analysis and correlations between parameters
– Spatial structure analysis (variography)
– Estimation using kriging– Conditional simulations using turning bands to explicitly account for uncertainty
Kartotrak, the integrated solution dedicated to contaminated site characterization, and Isatis.neo, the advanced geostatistics software, both flagship solutions from Geovariances, were used in this study.
For a project owner on an earthworks project, classifying excavated soils by treatment route before works begin is a major challenge. In this context, our collaboration with Geovariances enabled us to derive relevant conclusions from borehole data with varying densities.
This approach allowed us to gain a better understanding of subsurface conditions without requiring additional investigations.
— Erwan Le Priol – Project Manager, PSMO Project – HAROPA PORT
RESULTS
The probabilistic approach based on geostatistical simulations enabled:
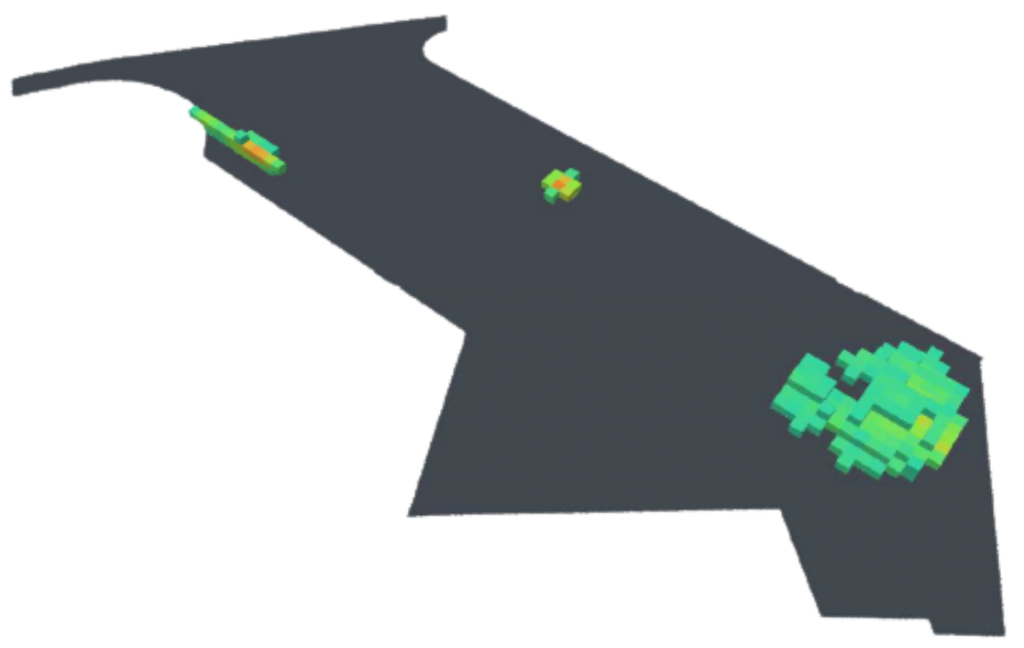
– The production of decision-support maps adapted to the excavation grid
– The calculation of threshold exceedance probabilities
– Robust estimation of volumes and masses per disposal route
– Risk assessment with a criterion set at a maximum of 30% probability of threshold exceedance per route
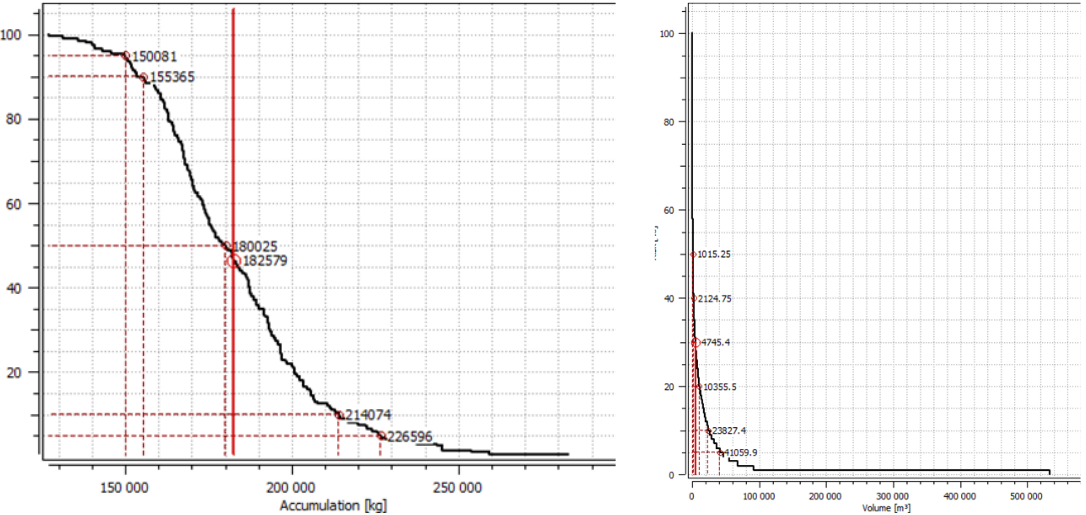
Left: example of a pollutant mass distribution curve, here for total hydrocarbons C10–C40 in place. Mean = 183 t.
Right: volumes of soil with C10–C40 concentrations exceeding 2000 mg/kg, as a function of exceedance risk. At a 30% risk level, the estimated soil volume is 4,745 m³.
“Risk” is defined as the maximum probability of sending contaminated soils to a lower disposal route. Allocating the corresponding volumes to a higher route ensures that the soils sent to the lower route have at most an x% probability of exceeding that route’s thresholds.

COMPARISON WITH A MORE TRADITIONAL APPROACH
To support decision-making, results were compared with a more traditional approach previously used: estimating volumes per route based on the 75th percentile (Q75) of simulations, rather than a fixed 30% risk level.
- What is the difference?
— Probabilistic approach (30% risk)
Volumes allocated to higher routes ensure that soils remaining in lower routes have at most a 30% probability of exceeding thresholds.
— Q75 approach
A conservative value is used for each parameter, but without a direct and explicit link to a defined risk level. - What do the results show?
The maps are very similar: the main spatial patterns of disposal routes remain consistent, confirming the model’s robustness.
However, the Q75 approach results in slightly higher volumes on the most restrictive routes because it is more conservative. This provides a useful sensitivity analysis.
CONCLUSION: BENEFITS FOR PROJECT OWNERS
The geostatistical approach offers a key advantage: it directly links estimated volumes to a clearly defined and controlled risk level.
Decision-making is therefore based on an explicit trade-off between safety level and budget impact.
Key benefits:
– Clear and quantified view of volumes per disposal route
– Better anticipation of treatment costs
– Reduced risk of budget overruns
– Informed decision-making based on probabilistic scenarios
By explicitly integrating uncertainty, the methodology helps secure the budget of a critical project phase.