Geovariances successfully helped us in building high quality hydrostratigraphic surface maps using local geostatistics
The St. Johns River Water Management District, located in northeast Florida USA, needed to create precise boundary surfaces of hydrostratigraphic units for input into groundwater models. In 2010, they required Geovariances to help them build their mapping procedure. Local geostatistics and thickness-based kriging revealed to be the solutions to answer their issue. Since then, Geovariances maintains their process.
By Jeffrey B. Davis, P.G. Division of Groundwater Programs.
Challenge
The study objective was double: (1) to identify specific units and (2) to achieve mapping across political boundaries, although previous work typically focused on specific regions of the state.
The problem was complex because:
- Florida geology is complicated by karst surfaces developed in many of the geologic units. Structural features include broad uplifted regions and erosional basins.
- The number of boreholes that penetrated the various units varied from over 5,000 for the Upper Floridan aquifer to 151 for the deepest unit mapped, the Lower Floridan aquifer. Spatial distribution of boreholes also varied with some areas having clustered data points and others with scarcely sampled data. The point distribution is also a concern when one unit has thousands of points and a lower unit only has a few, sometimes resulting in a surface unrealistically crossing an overlying surface.
- New data are constantly being added and a simple method to update the surfaces was required.
- A critical goal was to have the surface estimations honor the data points and capture both the short-range features (such as boreholes drilled into buried sinkholes) and the long-range regional structure. The resulting surface should also be realistic without erratic high or low values where there were no data.
- A peer review of the techniques was desired since there may be legal challenges during the District regulatory process.
Solutions
A project was initiated in Isatis to assimilate hydrogeologic data from multiple sources and develop consistent regional hydrogeologic unit surface estimations at the scale of the Florida peninsula. Tests using ordinary kriging for each unit were done and problems were identified, such as lower surfaces crossing upper surfaces in the area where the lower units were scarcely sampled.
Based on the preparatory study it was determined that a Local Geostatistics approach (a variant of kriging which makes use of local variogram parameters) would be best for the well sampled surfaces of the Upper Floridan Aquifer.
To resolve the problem of inconsistencies related to an upper, highly sampled surface compared to a deeper, scarcely sampled surface, an approach based on thickness was chosen for the Lower Floridan Aquifer surfaces.
Besides, it was decided to register the whole mapping process in Isatis batch procedures to allow a continued and simple update of the model with new data.
Results
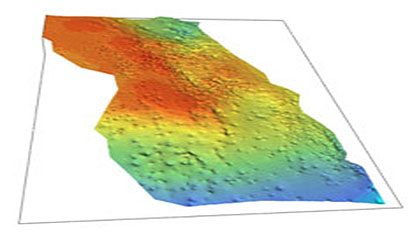
Big variability in Upper Floridan Aquifer surfaces is well managed by Local Geostatistics
An example of the local range map for the top of the Floridan Aquifer System is shown in Fig 1.
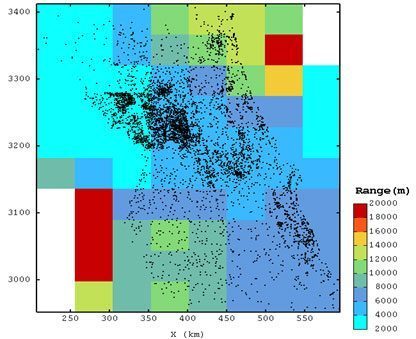
The varying range in the models can account for the difference in variability in the District. The central region shows smaller ranges (more variability), whereas the northern and southern regions shows a more continuous behavior (larger ranges). This helps solve the problems related to mapping the highly variable karst surface in the central regions compared to other regions where the surface is not as affected by karst or structural features.
High difference in sampling density in Lower Floridan Aquifer surfaces is managed by thickness-based model
Consistent with the regional geologic structure, it was determined that the tops of the deeper horizons were well correlated with the upper more densely sampled horizons. The upper unit grids were smoothed to minimize the impact of local variations. Thickness was calculated where data was available. A comparison of three different method results demonstrate the effectiveness of kriging the thickness based on a filtered upper unit:
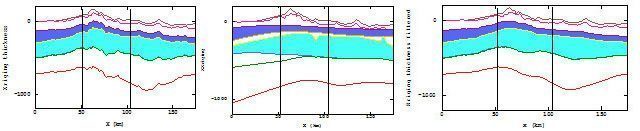
In Fig. 2, the last cross-section shows the deeper surfaces which capture the trend of the overlying filtered surface and produce realistic surfaces based on the limited data.
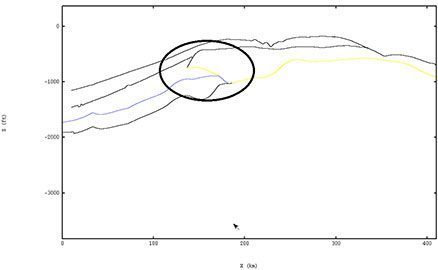
The procedure helped solve issues related to mapping a lower surface with 151 points compared to an upper surface with over 5,500 points for an area the size of peninsular Florida. Through modifications to the original workflow process, the model was able to model an area where certain units overlapped and had a separation between them. These units also pinched out laterally so the workflow was able to represent that characteristic as well. (see Fig. 3).
Surface models are updated with new data
Parameters are reviewed and updated using Isatis batch procedures.