Isatis has proven its ability to handle various data with quality control
Quick facts
The European project CoralFISH aims at assessing the interaction between cold water corals, fish and fisheries, in order to develop monitoring and predictive modeling tools for ecosystem-based management in the deep waters of Europe and beyond. CoralFISH brings together a unique consortium of deep-sea fisheries biologists, ecosystem researchers/modellers, oceanographers, economists and a fishing industry SME, who are collaborating to collect data from key European marine eco-regions. The consortium numbers 17 partners from 11 countries. In France, the French Research Institute for Exploitation of the Sea IFREMER has contributed to the project by improving the habitat knowledge on the northern margin of the Bay of Biscay (see figure 1).
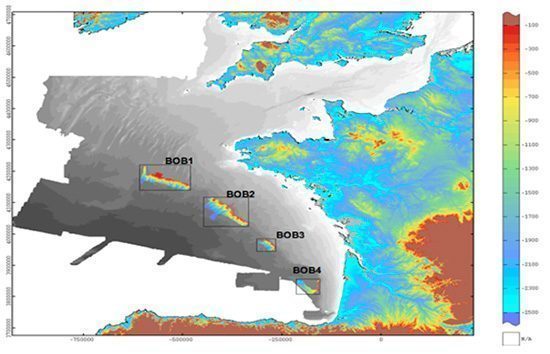
Figure 1: Location of the four key sectors studied by IFREMER in the framework of the CoralFISH project
The challenge
To compute the various maps of the concerned area, Ifremer was looking for a software solution allowing them to:
- Integrating data coming from various scientific disciplines,
- Performing sectors and identifying particular geological structures.
The solution
Ifremer uses Isatis since its first release in 1993. It was quite natural that the institute chose the software which they know can meet the challenge. In the many projects Ifremer conducted all over those years, Isatis has proven its ability to handle data with quality control and to bring together data from a variety of different technologies (for example, multibeam, seismic, sonar, submersible) into a single database. Specific plugins allowing slope calculation or drainage network extraction were also developed or implemented by Geovariances at Ifremer’ request and can help them with the advanced data processing the CoralFISH project requires.
The results
Geostatistical methods and morphological operators available in Isatis have been used for this specific project. First, bathymorphological maps have been obtained by combining recent multibeam bathymetric data with prior Digital Terrain Models (DTM). In addition to classical mapping methods, residual bathymetry artifacts have been successfully filtered out using factorial kriging, therefore improving the DTM before subsequent processing.
Regarding geomorphology, a set of parameters are first computed directly from the bathymetry (bathymetry trend, local and regional slope, orientation…). They allow delineating large physiographic sectors or megageoforms as the shelf, the slope and the rise. Then more complex parameters are computed to identify particular geological structures. For instance, the catchment basins and their canyons are automatically identified and the main thalwegs validated. Weighted distance to the nearest thalweg is combined with the slope to distinguish canyon areas from interfluve areas.
Classification of kilometric to decametric geomorphological features is then performed by checking their connexity and coding them automatically. A final validation allows correcting specific elements or too small features. Figure 2 below illustrates the type of geomorphological map obtained in of the four areas of interest.
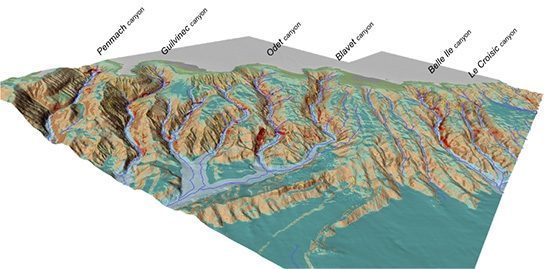
Figure 2: 3D view of the geomorphological classification for the Bob2 sector (see legend hereafter) – Courtesy Ifremer
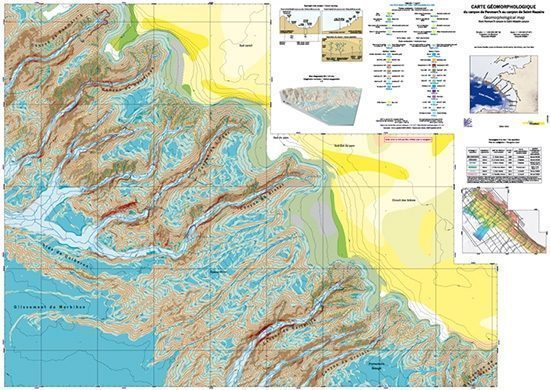
Figure 3: Geomorphological map from Penmarch Canyon to Saint-Nazaire Canyon – Courtesy Ifremer