Whatever your site characterization budget, sampling exhaustively the areas of interest always remains unrealistic. Therefore, any sampling areas will leave under-sampled areas or depths, leading to uncertainty in your knowledge about the contamination distribution.
Geostatistics provides suitable methods that allow you to integrate all acquired data to predict contamination levels at unsampled locations. In addition to such contamination mapping, quantifying the uncertainty related to your knowledge of the contamination will help you anticipate potential risks or discoveries that may occur during remediation.
ACCURATE AND PRECISE CONTAMINATION MAPPING
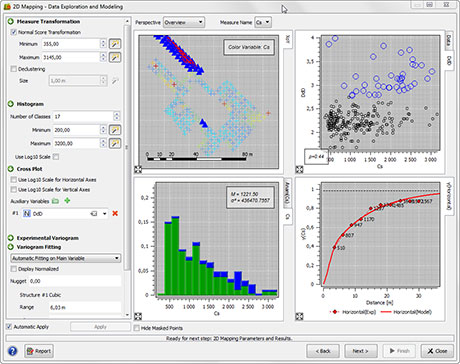
Variogram analysis helps you quantifying the spatial variability of your parameters of interest in order to capture the specificity of your suspected contamination: inorganic contamination in backfill, hydrocarbons in the floating phase of an underground aquifer, radiological contamination.
Contamination mapping with kriging-like techniques then provides you with the most realistic contamination model, highlighting key areas of interest for your conceptual site model.
Site characterization involves more and more commonly the acquisition of various types of data: laboratory analysis, on-site XRF measurements or geophysical surveys, in-situ acquisition such as MIP or other logging tools as well as dose rate and in situ gamma spectrometry for radiological contamination. Another key advantage of geostatistical interpolation methods lies in the ability to consistently combine these data in order to refine your contamination model and increase its relevance even more.
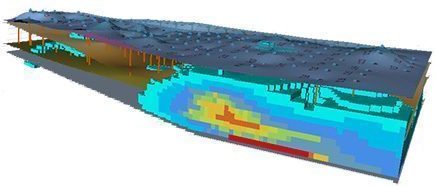
2D AND 3D VISUALIZATION
Forget Excel spreadsheets and site maps covered by bubbles at data locations. 2D and 3D visualization of realistic contamination models, together with the site environmental context, provides you with invaluable solutions for communicating much more efficiently with other stakeholders.