Kartotrak helps Dekra to justify their decisions
One activity of Dekra group, the European leader in inspection and certification in the construction, the industry, the environment and the transportation sectors, is to diagnose and assess the environmental situation of a site. It is within this framework that DEKRA Industrial implements geostatistics since 2012.
Problematics
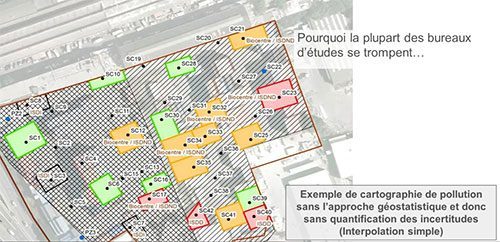
“Our work is to provide our clients with the decision criteria they need to prepare site management plans for future remediation. Before we decided to include a geostatistical approach in our projects, we were used to getting contamination maps based on very simple interpolation methods and empirical calculations. We needed a rational solution which enabled us to justify undoubtedly our conclusions.”
National Technical Manager, Polluted Sites and Soils at Dekra Industrial France, Damien Faisan explained.
Solution
Damien Faisan was already convinced of the relevance of geostatistics to answering its needs of rationality. He chose the software solution Kartotrak because, he said, it is an easy-to-learn and easy-to-use software that perfectly works together with the GIS used at Dekra Industrial France in their studies.
Thus, Kartotrak lets his team:
– Compile, clean and homogenize data;
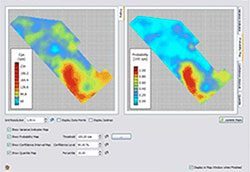
– Map contamination in a more detailed and realistic way, geostatistics (and interpolation by kriging) allowing to take into account the spatial behavior of the pollutant(s).
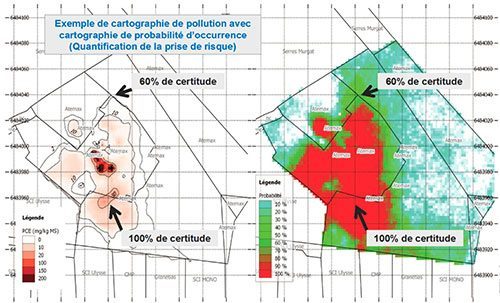
– Establish probability maps indicating where it is more certain to find the expected level of pollution;
– Quantify the polluted volumes with the associated uncertainties;
– Display the contamination models and surveys in the same 2D or 3D view.
Results
Identification of hot spots
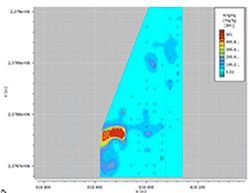
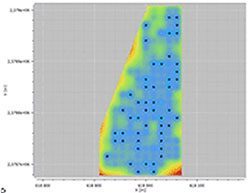
Kartotrak delivers maps that immediately allow the identification of the most polluted zones or the much less sampled.
Financial risks control
Because the calculated polluted volumes are systematically associated with a level of uncertainty, Kartotrak enables us to assess the margin of error associated with the remediation budget and to secure it.
Decisions based on sound information
Kartotrak allows Dekra Industrial to provide their clients with probability maps of the occurrence of a given level of pollution. Thus, decisions are fully informed.
With geostatistics, results obtained are based on an opposable scientific basis, which makes possible any counter-expertise.
Better communication with the client
« 2D and 3D maps are an unequaled communication tool. Our clients are able to visualize future work at first glance!” Damien Faisan concludes.
Perspectives
At Dekra Industrial, Kartotrak is today used for projects with high stakes and for which the need to secure prescriptions is essential. Nevertheless, the methodology related to site studies is in constant evolution, this means that the use of geostatistics in the projects will tend to expend.