The use of automatic workflows in Isatis enabled the production of 350 maps in half an hour
The Marine Environmental Science Laboratory LEMAR is a Brittany-based research organization attached to Ifremer, the French Research Institute for the Exploitation of the Sea. One project of this laboratory focuses on the study of the origin and spread of marine viral diseases in oysters. To help identify risk factors at the regional scale, the study was made using a spatial epidemiology framework. In this context, LEMAR implemented Isatis to map various environmental parameters that can explain the mortality rate of the oysters.
The issue
The risk of epidemiology in oyster farms depends on numerous environmental parameters and their interactions with hosts and pathogens.
To improve the monitoring of the parameters’ change and identify risk factors that affect disease dynamics at the regional scale, it has been decided to conduct the study using a spatial epidemiology framework. It consists in the description and analysis of geographical variations in the disease.
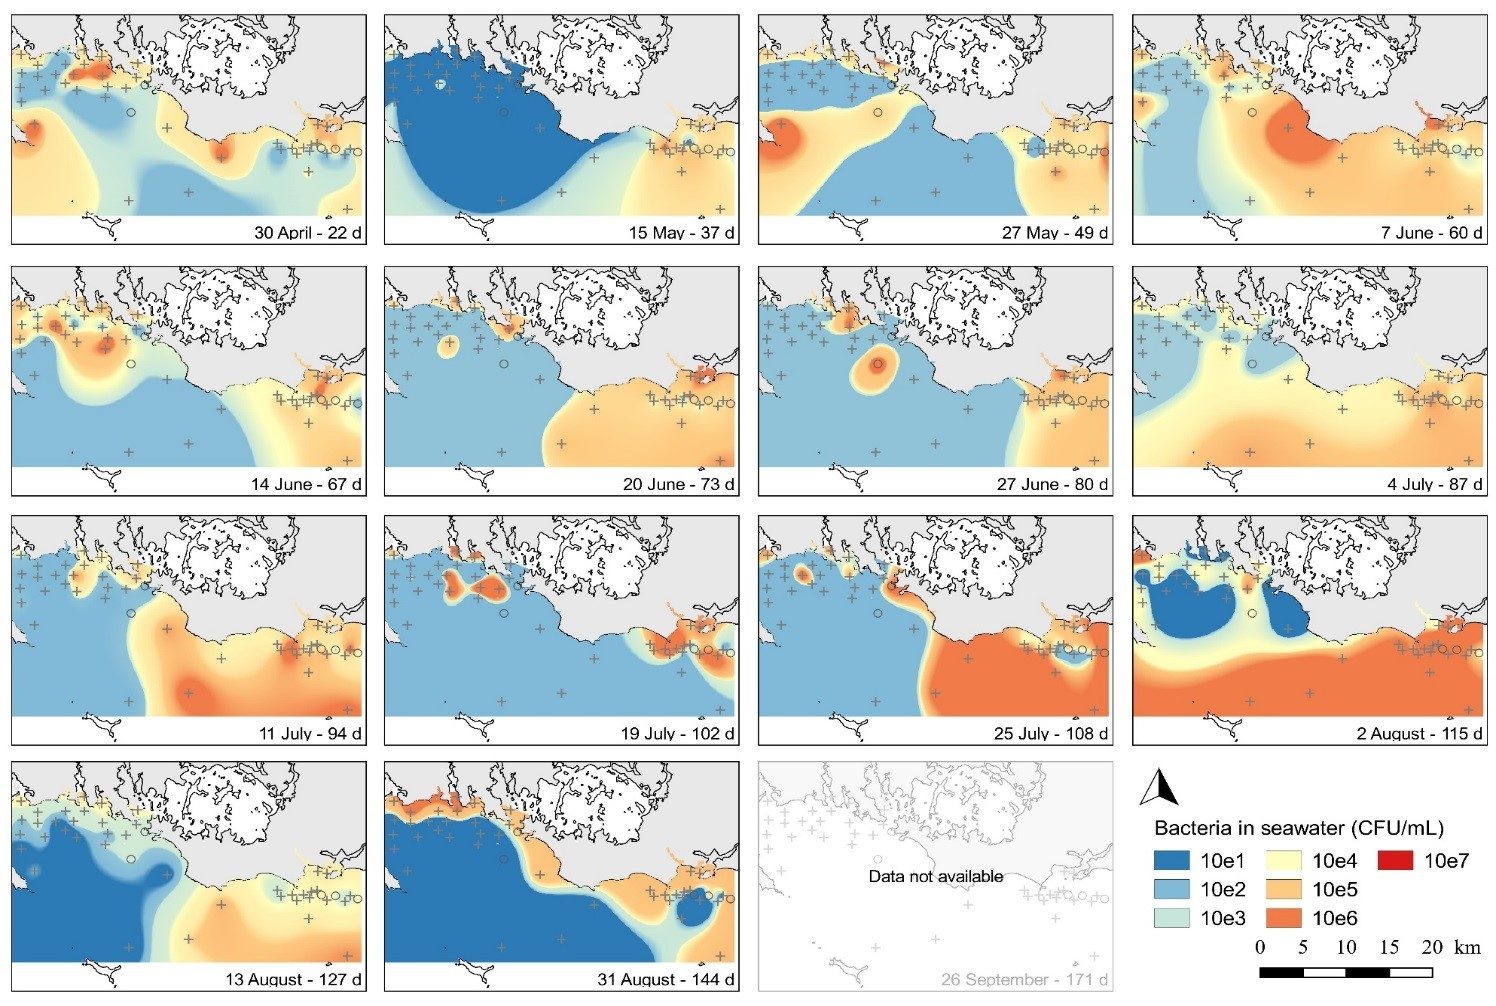
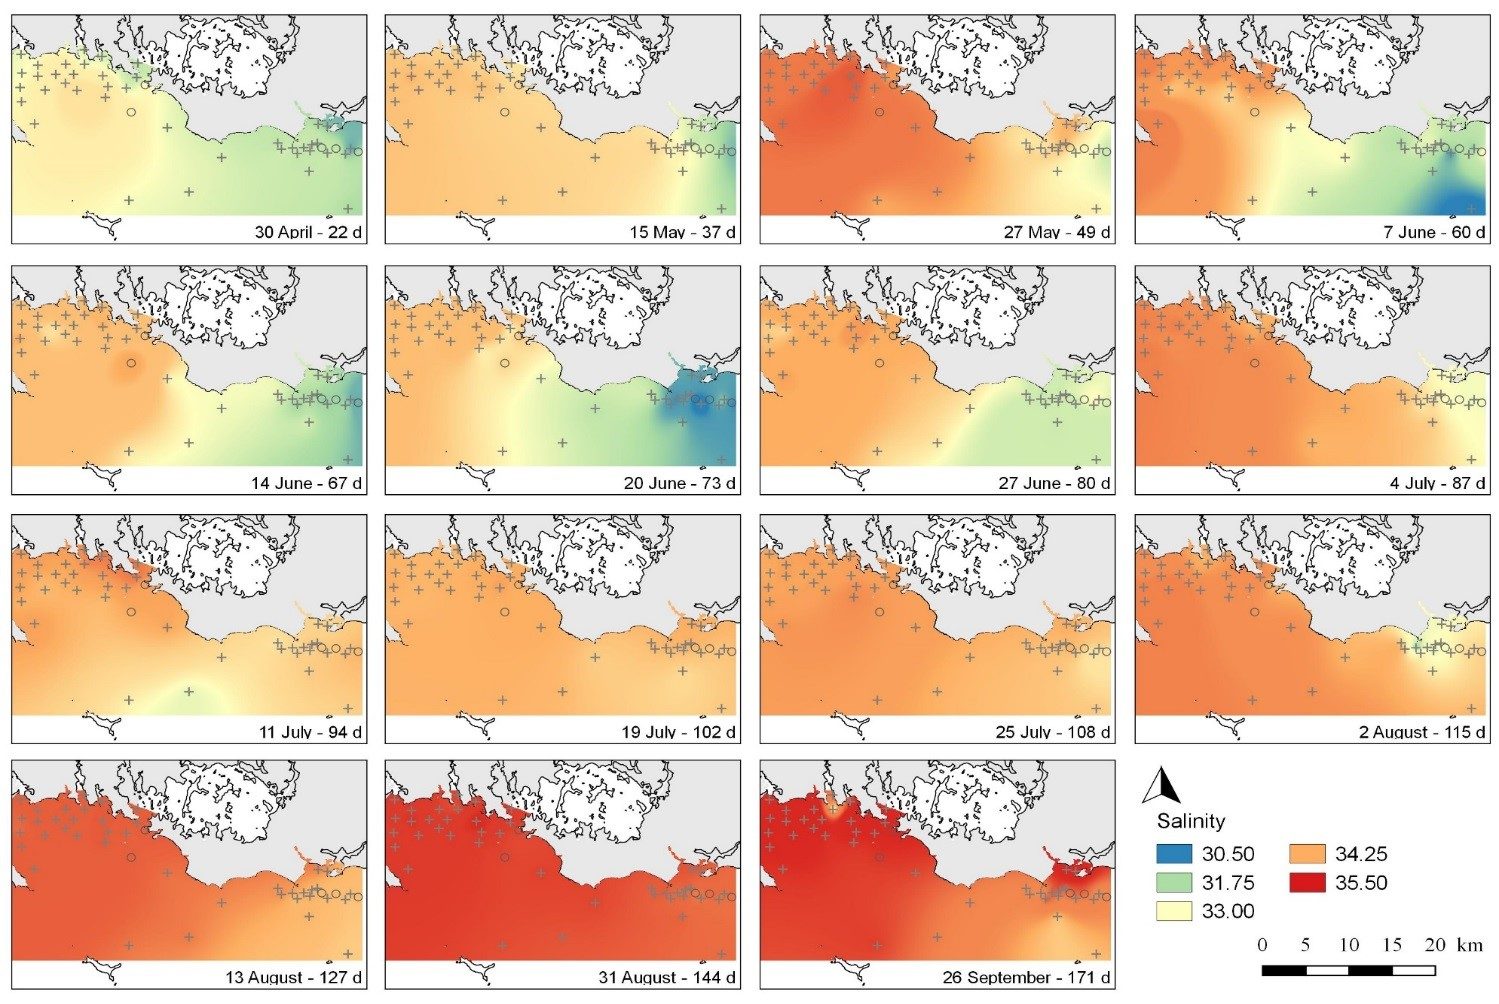
The study involved the monitoring of the oyster mortality rate and about twenty environmental parameters (including sea water temperature, salinity, fluorescence, turbidity and oxygen quantity) on 46 sites in South-Brittany distributed over an area of 300 km² during 6 months.
A large volume of data was thus collected. The objective was to quickly map all the measured parameters to isolate those that best explain the disease evolution, and that had to be monitored over time.
The solution
Isatis, which is used at LEMAR since 2009, was used for this specific project. Fabrice Pernet, researcher at Ifremer, values the software because of:
- The simplicity with which spatial data analysis can be achieved. “Isatis is a tool fully dedicated to spatial analysis, more convenient to use than the GIS I use besides.”, said Fabrice Pernet. “With the variogram cloud, I easily identify outliers and immediately locate them on the map thanks to the dynamic link that exists between the different statistical representations.” he added.
- The ease with which a variogram can be adjusted, either interactively with a simple “drag and drop” of the curve representing the chosen structure, or fully automatically. “You only need to click a button for the variogram to be perfectly adjusted.”, pointed out Fabrice Pernet.
- Its multivariate algorithms that allow considering the multitude of studied parameters and the correlation that can exist between them.
- The possibility to build and save mapping workflows that can be later run automatically in one mouse click.
The results
The implementation of an automated workflow created from Isatis scripting functions has allowed generating 350 maps in half an hour.
From these hundreds of maps, a dozen of parameters explaining the oyster mortality rate was quickly identified. Once again, the implementation of the mapping script file created at the previous step allowed calculating the corresponding maps in a quasi-immediate way.
Reference: Spatial epidemiology of viral disease in marine ecosystem at regional scale: lessons from the oyster Crassostrea gigas and the ostreid herpesvirus type 1 – Fabrice Pernet (Ifremer, Unité de Physiologie Fonctionnelle des Organisme Marins, LEMAR UMR 6539) and al.