When Ginger Burgeap engineers want to optimize site remediation, they use Kartotrak
The Ginger BURGEAP environmental consultancy, a leader in the remediation of polluted sites and soils for over 30 years, uses the Kartotrak software solution to establish mass balances, define areas of concentrated pollution, and quantify polluted volumes. What do they see as Kartotrak's strengths? The 3-dimensional visualization of the contamination and the site, the results' robustness, and the implementation speed.
For contaminated site management, it is conventional to calculate the volume of soil to be treated and establish the pollutant mass balance in a simplified way, using 2D kriged maps on which the zones exceeding a given rehabilitation threshold are delineated. This raises the question of the reliability of the figures used to draw up the management plan. How often has unexpected pollution been discovered in the middle of a project, leading to costly delays?
Numerous sources of uncertainty, such as sampling, subsoil heterogeneity, and even the map itself, which necessarily involves calculation assumptions and a choice of parameters used, reduce the quality of the information and therefore compromise the robustness of the results.
“Today, I believe that uncertainties can no longer be ignored. And Kartotrak is one of the tools on the market that allows us to take them into account.”
Juliette Chastanet, Project Manager in the Polluted Sites and Soils Department at Ginger BURGEAP and an enthusiastic Kartotrak user tells us this.
Ginger BURGEAP acquired Kartotrak in 2019 to take better account of uncertainties in their studies, and they have been using it ever since to establish mass balances at various stages of a site study:
- at the management plan level to establish cut-off thresholds delimiting areas of concentrated pollution or rehabilitation thresholds;
- at the pre-work stage, for preliminary sizing of the polluted volume;
- on completion of the work, to check that the pollution mass reduction targets have been met.
Kartotrak guarantees the robustness and reliability of estimated volumes and masses
“We systematically implement Kartotrak for high-stake sites when we need precision in volume and mass estimates and to optimize cleanup.”
Kriging tends to smooth interpolation. It can mask significant variations in pollution on the site, giving a false impression of homogeneity.
To overcome this effect of kriging, Kartotrak uses geostatistical simulations that reproduce the variability of the subsoil by producing a series of possible values representing many contamination scenarios. Probability maps of exceeding a threshold and curves of soil volumes to be treated are derived as a function of a rehabilitation threshold and residual pollution risk.
“Our customers need to know where the pollution is, how much there is, and what needs to be removed,” explains Juliette Chastanet. “That’s why we provide them with simplified 3-color probability maps of exceeding a threshold that help them better understand this notion of probability, with areas most certainly polluted showing probabilities over 80%, areas identified as unpolluted with very low probabilities, and uncertain areas.”
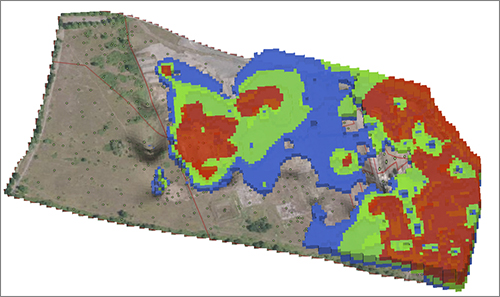
3D probability map of exceeding a remediation threshold: in red, areas considered polluted, with a risk of exceeding the threshold of over 50%; in blue, areas deemed healthy, with a risk of less than 30%; in green, areas with intermediate risk.
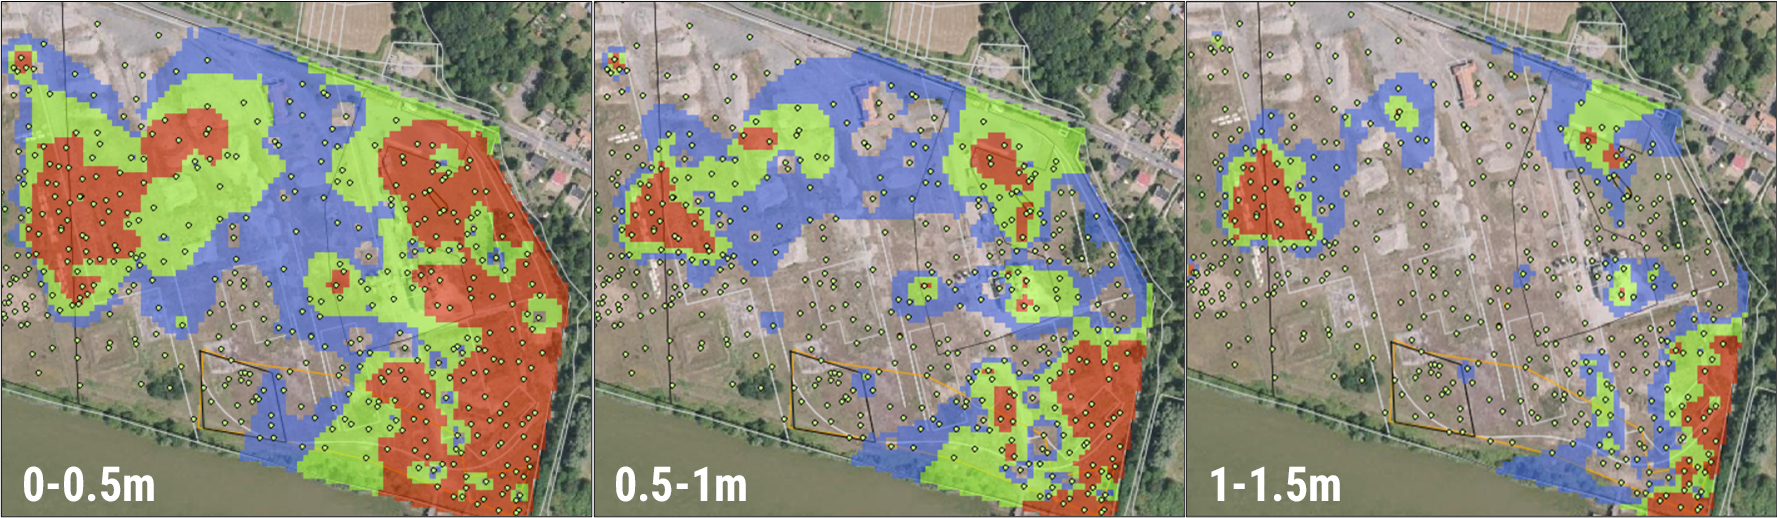
2D probability maps of exceeding a remediation threshold at different depths.
Kartotrak increases productivity
“Kartotrak makes it possible to carry out with a single desktop application the services we used to perform using several tools, thus saving us precious time.”
Before Kartotrak, Ginger BURGEAP engineers used a suite of tools to produce 2D maps, then post-process and calculate impacted volumes and masses.
Today, with Kartotrak, they have an integrated specialized tool enabling them to map pollution in 3 dimensions and quantify impacted soil volumes and masses. Kartotrak goes even further, calculating excavation plans and their efficiency according to the impacted volumes left in place.
Juliette Chastanet also highlights the speed at which Kartotrak manages large 3D data sets, for example, involving several thousand analyses.
Kartotrak provides 3D visualization
“Our customers appreciate 3D visualization; it’s undeniably a plus. Just visualizing the data helps them understand things better.”
Ginger BURGEAP’s usual solutions, working in 2D, don’t allow for this 3D visualization, which helps reinforce knowledge and better understand the site and enables rapid exchange of information between the consultancy office and the works contractor.
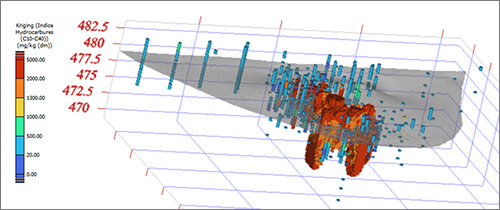
3D kriging mapping of a hydrocarbon index (C10-C40)
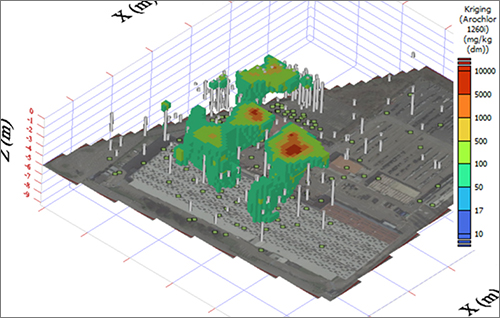
3D kriging mapping of Arochlor 1260i pollution with borehole display
Kartotrak is easy to handle
“Geovariances is very fast to answer our questions, which allows us to gain proficiency quickly.”
For Juliette Chastanet, Kartotrak’s ease of use is primarily due to its user-friendly interface. “At first, you’re feeling your way around, clicking on all the buttons, and you don’t quite understand what it does. But since Geovariances quickly responds, we get to grips with the software pretty fast.”
The fact remains that using Kartotrak requires training to understand the ins and outs of the geostatistical approach. At Ginger BURGEAP, an additional person will soon be trained by Geovariances as the number of studies on which the software is used grows.