How Geovariances tricks its own software Kartotrak for mapping indoor wifi coverage
Posted on Geovariances used Kartotrak.one to map the wifi coverage inside its premises and verify that the transition to a newer wireless networking transmission method has improved the signal across the office and is justified.
Kartotrak and its lighter version Kartotrak.one were initially developed for the domain of radioprotection. During the last decade, it has been vastly used by Geovariances and its clients for radiological contamination mapping and monitoring inside nuclear facilities, for example, for mapping dose rate measurements, surface activity, etc. This case study shows another example of a possible use of Kartotrak for current issues.
A few months ago, Geovariances decided to upgrade its facility’s WiFi networks from the IEEE 802.11g-2003 to the IEEE 802.11ac-2014 wireless networking transmission method. Two WiFi networks were available in the offices, a public one for general use and a private one to communicate with the company servers, with two access points, one being dedicated to the public network, the second one to the private network. Exactly at the same locations, the old access points were replaced by two new access points, each of them being able to make both networks accessible.
This study draws attention to the high spatial correlation between the measurements, which justifies the application of geostatistical tools for mapping signal coverage for indoor and outdoor cases.
We used Kartotrak.one and geostatistical interpolation methods to compare the network accessibility before and after upgrading the two access points.
Measurement, import, and variography
We measured two parameters before and after system upgrading using a laptop: WiFi signal attenuation in decibel milliwatt [dBm] and download speed in megabit per second [Mbps]. It was then easy to import these measured values in Kartotrak through Excel files. After a quick quality control (missing values, coordinate errors, N/A, etc.), we performed exploratory data analysis and variography analysis. We recall that the variogram describes the spatial correlation of data as a function of distance.
Exploratory data analysis
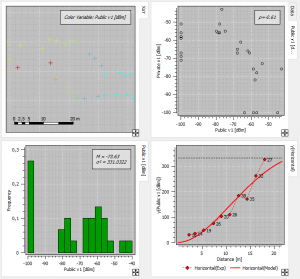
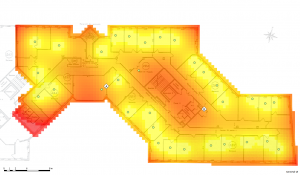
Mapping signal strength
Based on the measured values and the fitted variogram, we used ordinary kriging to interpolate data and produce maps on a grid size of 50 cm.
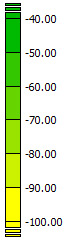
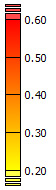
The maps of signal attenuation for public and private networks before and after system upgrading are illustrated below.

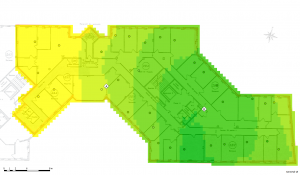
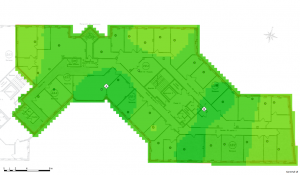
The maps prove that network signal has been strengthened after the system upgrade. The minimum signal attenuation before upgrading is -100 [dBm] which is increased to about -70 [dBm] after upgrading. In addition, both public and private networks are now accessible in all the offices with a more homogenous strength.
Besides an interpolated map, kriging methods deliver a kriging variance map which is an indicator of the interpolation error. The areas with lower measurement density are susceptible to have a relatively higher error of interpolation. This result helped us to judiciously define some additional sampling locations to eliminate the highest interpolation errors for a better quality of the maps.
Geostatistical capacity
Assessing network coverage based on discrete measurements is here done in an indoor case-study. This study shows a high spatial correlation between the measurements, which justifies the application of geostatistical tools in mapping signal coverage for indoor and outdoor cases. This innovative application of geostatistics can give a hand to telecommunication companies to provide visibility of their network coverage in 2D outdoor cases, like cities, or 3D indoor cases, like buildings and underground spaces.
Mining (14)
Nuclear Decommissioning (9)
Contaminated sites (7)
Oil & Gas (6)
Hydrogeology (5)
TAGS:
2D/3D (2)
Background images (1)
Big data (1)
Conditional simulations (7)
Contaminated sites (2)
Contamination (2)
Drill Hole Spacing Analysis DHSA (3)
Excavation (2)
Facies modeling (2)
Flow modeling (1)
Geological modeling (3)
Gestion des sites pollués (2)
H2020 INSIDER (1)
Horizon mapping (1)
Ice content evaluation (1)
Isatis (11)
Isatis.neo (16)
Kartotrak (8)
Machine Learning (2)
Mapping (3)
MIK (2)
Mineral resource estimation (7)
Monitoring network optimization (1)
MPS (2)
Ore Control (1)
Pareto (2)
Pollution (2)
Post-accidental situation (2)
Recoverable resource estimation (3)
Resource classification (2)
Resources workflow (1)
Resource workflow (3)
Risk analysis (3)
Sample clustering (1)
Sampling optimization (3)
Scripting procedures (3)
Simulation post-processing (1)
Site characterization (2)
Soil contamination mapping (4)
Time-to-Depth conversion (1)
Uncertainty analysis (2)
Uniform Conditioning (5)
Variography (2)
Volumes (2)
Water quality modeling (1)
AUTHORS:
David Barry (3)
Yvon Desnoyers (2)
Pedram Masoudi (2)
Pedro Correia (1)
Catherine BLEINES (1)
DATES:
2023 (2)
2022 (3)
2021 (2)
2020 (2)
2019 (8)
2018 (4)
2017 (3)
2016 (3)